Portfolio Analytics for Data-Driven
Hospitality Organizations

Hospitality leaders have lowered expenses, increased revenue, and improved efficiency by harnessing the power of their data.

Who We Help

Transform your entire organization from top to bottom.

Investors

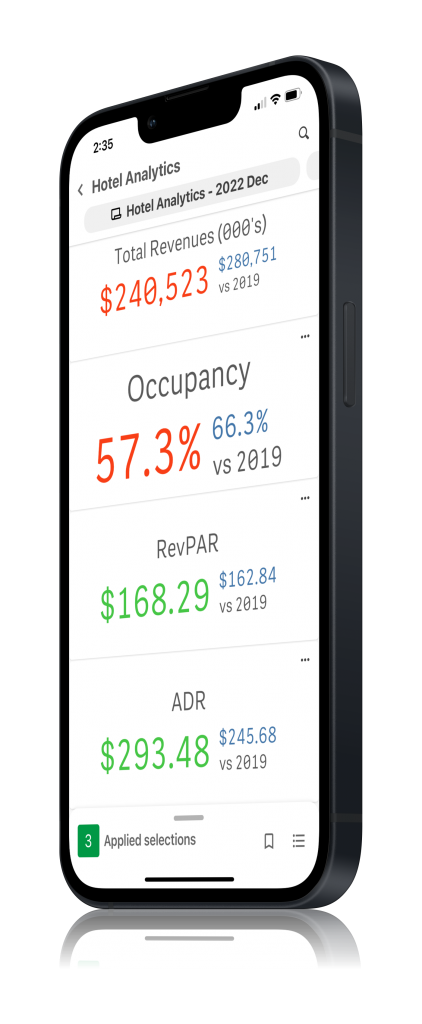
• High level Key Metrics
• Occupancy
• ADR
• RevPAR
• EBITDA
• Total Properties
• Easily Consumed
• Clean, Clear, Polished

Executive Leadership

• Occupancy
• ADR
• RevPAR
• EBITDA
• Other Key Metrics
• Analyze KPI by Comp Set
• Dashboard w on-demand detail
• Time Series
• Mobile

Operations

• Standard Benchmark Reporting
• Comparison and Difference Reporting
• Standard Reporting Outputs
• Excel Output
• Data Validation
• Auditability

Asset Managers

• Performance Metrics
• Property Level KPI’s
• Scenario Modeling
• Forecast Modeling
• Process Integration
• Planning
• Data Types

Hospitality Solutions

More insights for Executives. Full transparency for Finance. Less hassle for IT.

Hotel/REIT

Earnings calls with investors and visibility to your most important metrics are fast, accurate, and available when you need them, where you need them.

Gaming

Guest Comps, Revenue, F&B and Event metrics are easily available for every user. Everyone wins!

Cruise

Shore Side or Shipboard, cruise teams are aligned with APCD, POS, or Reservations information that makes every voyage smooth sailing!

All your KPI's in one place

No more sifting through multiple reports wondering if the information you have can be trusted. View everything you need to make the right decisions at the right time. Both on Desktop or Mobile!

REIT and Hotel Industry
Performance Management

Gain critical insights into hotel operations and other key performance metrics.

Stop relying on tethered spreadsheets to manage your organization. Confidently benchmark properties against flexibly selected or standard market baskets, and deliver KPIs to key stakeholders with a scalable performance management solution.

Hospitality and Gaming Market KPI's

Front Desk Analytics provides robust Performance Management solution to provide hospitality leaders with the key metrics required for investors, executive management, revenue management teams, and analysts.

Visitors attending conventions, conferences, and other meetings generate significant occupancy demand for the hospitality industry to include gaming.

Convention and meeting attendance drive about 15% of hospitality visitors, depending on the location.

The RevPar, Occupancy%, Average Daily Rate (ADR), metrics, when coupled with Gaming Revenue, are the main KPI’s driving performance insight in the gaming industry.  Add that to F&B and conferences and a comprehensive picture of your property’s performance can be delivered to your mobile device daily.

No more sifting through multiple reports wondering if the information you have can be trusted. View everything you need to make the right decisions at the right time. Both on Desktop or Mobile!

Cruise Line KPI's delivered easily to stakeholders

Voyage Revenue & Analytics

Shipboard & Shore-side Analytics

Portfolio Analytics for Data-Driven Hospitality Organizations

In this 30-minute demo, you will learn:

Your contact details are managed within our Privacy Policy.  You may opt-out of any marketing emails.